


Matching rising star innovators to pharma areas of interest

One analogy often used to describe the lifecycle of life sciences innovation is a relay race. More so than in any other sector, startups in the life sciences tend to follow a distinct progression, with clear segments demarcated by well-understood scientific and commercial milestones. The exact segments of the race differ from sub-market to sub-market, and from company to company, but the phases of the overall race tend to share the same components.
Last year, I shared a simple framework for university-embedded startups to navigate the earliest stages of this race. If you are a professor or grad-student thinking about forming a startup around a university technology, I wrote this piece for you. In today’s post, I’ll zoom out and focus on the beginning of the race and the end.
For life sciences startups, the starting gun is often an “Aha!” moment in a university lab, and the endpoint is a pharmaceutical company manufacturing and delivering a drug to patients. Even for the runners (startup founders), this race can seem abstract at times. But whether you are a runner, a coach, or a bystander, you should feel invested; every race run successfully means a new treatment for an un- or under-treated disease.
At Portal, we specialize in the earliest stages of these relays - helping founders get the infrastructure, capital, relationships, and race plan to get from “Aha!” to a Series A and beyond. One of the ways we do this is by helping match the ideas of RisingStar scientists (the starting-gun runners) with corporations, especially big pharma (the finish-line runners).
The aim here isn’t necessarily to drive partnerships right off the bat, though that can happen and it’s great when it does. The goal, rather, is to help the sources of innovation know where the “buyers” are looking, and to help “buyers” see what’s coming and calibrate their pipelines accordingly. To say it another way, it’s impossible to complete a relay race if this first runner doesn’t know where the final runner is going to be, and vis versa.
Toward this end, most large and mid-cap pharmas regularly update areas of interest - specific diseases, technologies, and medical unmet they are targeting - and communicate these to universities and startups. But from a university or startup’s perspective, keeping up with the changing areas of interest of dozen’s of corporations can be a daunting task. And corporations experience the opposite challenge, as they try to keep tabs on the ever-evolving landscape of science, as well as the movement of innovators amongst hundreds of research universities.
Portal’s position as a network builder in biotech puts us in regular contact with both pharma and university leaders, putting us in the position to regularly see this disconnect, while enabling us to serve as a bridge between the two.
As we’ve built Stargaze - our tool for mapping, sourcing, and predicting innovation - we’ve kept this problem top of mind. One of the use cases we have developed, and continue to pursue, is matching RisingStar innovators with Pharma areas of interest in a way that is simple, interpretable, and massively scalable. Below is how we do it.
1) Map the Innovation Landscape at Baylor College of Medicine
First, we pick an innovation ecosystem and create a custom Innovation Atlas. (More on how we do that, here.) Similar to previous Innovation Atlas’s we have shared (e.g. here, and here), the one below depicts papers, patents, grants, and scientists over a defined period of time - in this case, covering about ten years of innovation at the Baylor College of Medicine (BCM). Our approach, however, can scale to encompass the whole of biotech. Today we can depict whole cities, regions, and technology domains on a single map. In future iterations we plan to capture the entirety of US biotech on a single map, expanding thereafter to other domains of knowledge and ex-US geographies.

2) Map Takeda’s Areas of Interest
Next, we search our catalogue of pharma areas of interest - which we update regularly - to extract concepts from the catalogue and map them to our Innovation Atlas. Below, for example, we map a portion of Takeda’s 2022 areas of interest - those within Gastroenterology - to the work of current researchers at BCM.

3) Search for Baylor Innovation Clusters
After mapping Takeda’s areas of interests to BCM’s innovation ecosystem, we take in the big picture and search for denser pockets of innovation, which often correspond to innovation sweet spots at an institution. We can see several of these at Baylor, which we then isolate and map to 9 different “topic clusters” at Baylor: Metabolism, Microbiome, Microbiota, Hepatology, Intestinal Cells, Transplantation (General), Liver Transplantation, Gastrointestinal Disorders, and Gastritis. (As part of our innovation mapping process, Stargaze uses several AI algorithms to automatically find and labels these clusters. They are unique to each institution).

4) Explore Baylor Clusters
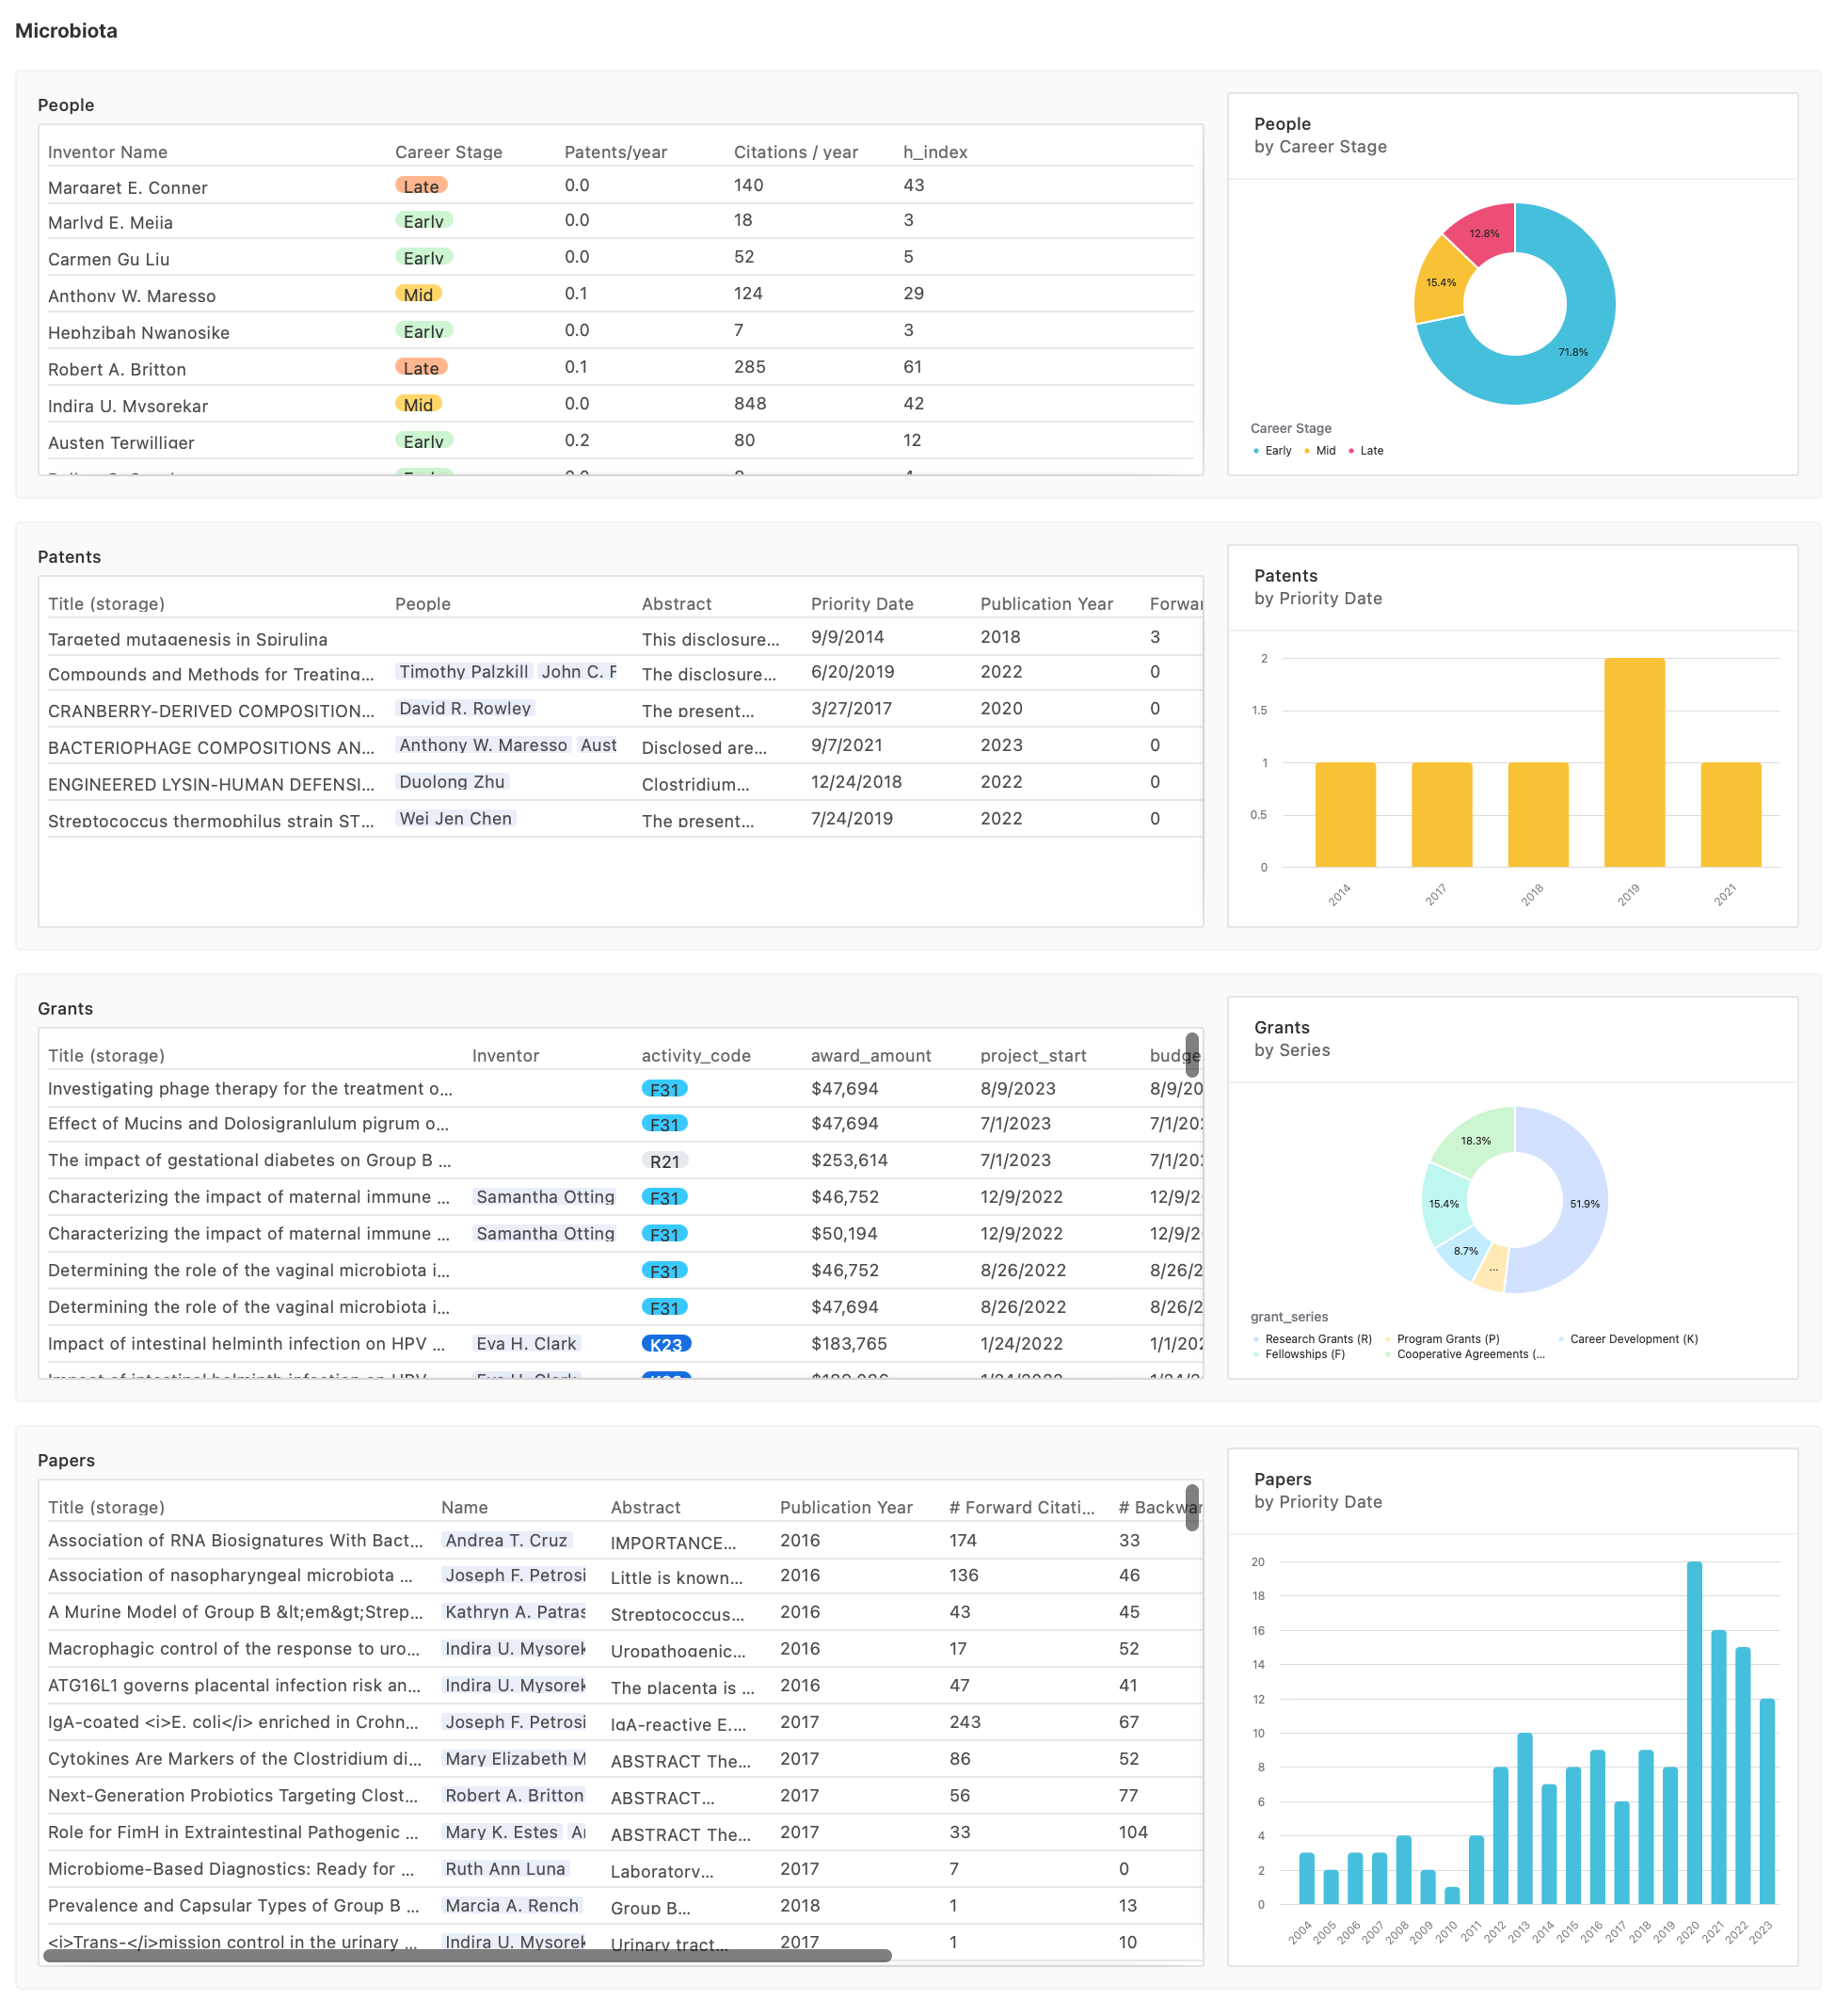
Next, we utilize a series of Starcharts, to look explore each of the clusters we found. Below is an example high-level Starchart of the “Microbiota” cluster at BCM, showing the people, patents, papers, and grants within it, as well as a representative population statistic for each. Of note, Starcharts are interactive, and many-layered, giving us the ability to explore, follow hunches, and develop our own hypotheses.
5) Find RisingStars at Baylor that match Takeda Interests
Lastly, we utilize another module within Stargaze, Starfinder, to zero in on researchers within all of the clusters we identified, that exhibit innovation biomarkers. Our panel of innovation biomarkers is constantly growing, as we incorporate new insights from our own work, as well as those from the broader metascience literature. We call the subset of researchers exhibiting these biomarkers RisingStar innovators. Because scientists often act differently, and take different types of risks, at different stages of their career, we separate RisingStars into career stages. At Baylor we identified 18 RisingStar scientists working in hotspots directly related to Takeda’s gastroenterology areas of interest.

Conclusion
The value of a tool like Stargaze is, of course, not in comparing a single pharma area of interest against a single university. It is in doing this at scale. With Stargaze, we can compare all of Takeda’s areas of interest against a much broader panel of universities. Or, conversely, we can map all of Baylor’s science across all pharma areas of interest. The Stargaze approach is massively scalable, and that’s the point.
To use one more analogy from drug discovery: you can think of Stargaze as a high throughput screen for innovation. In the same way that drug designers use high throughput screens to search chemical libraries for compounds that could hit therapeutic targets of interest, Stargaze searches universities for RisingStar innovators that could match pharma areas of interest.
Stargaze doesn’t replace the hard, relational work of turning hits into leads, so to speak. But it does make that process much more efficient, reduces blindspots, and, we hope, will lead to more “Aha” moments in university labs eventually reaching patients.